Grundläggande statistik
| Institutionella ägare | 287 total, 268 long only, 1 short only, 18 long/short - change of −0,52% MRQ |
| Genomsnittlig portföljallokering | 0.1425 % - change of 9,55% MRQ |
| Institutionella aktier (lång) | 29 531 750 (ex 13D/G) - change of −1,33MM shares −2,42% MRQ |
| Institutionellt värde (lång) | $ 1 305 088 USD ($1000) |
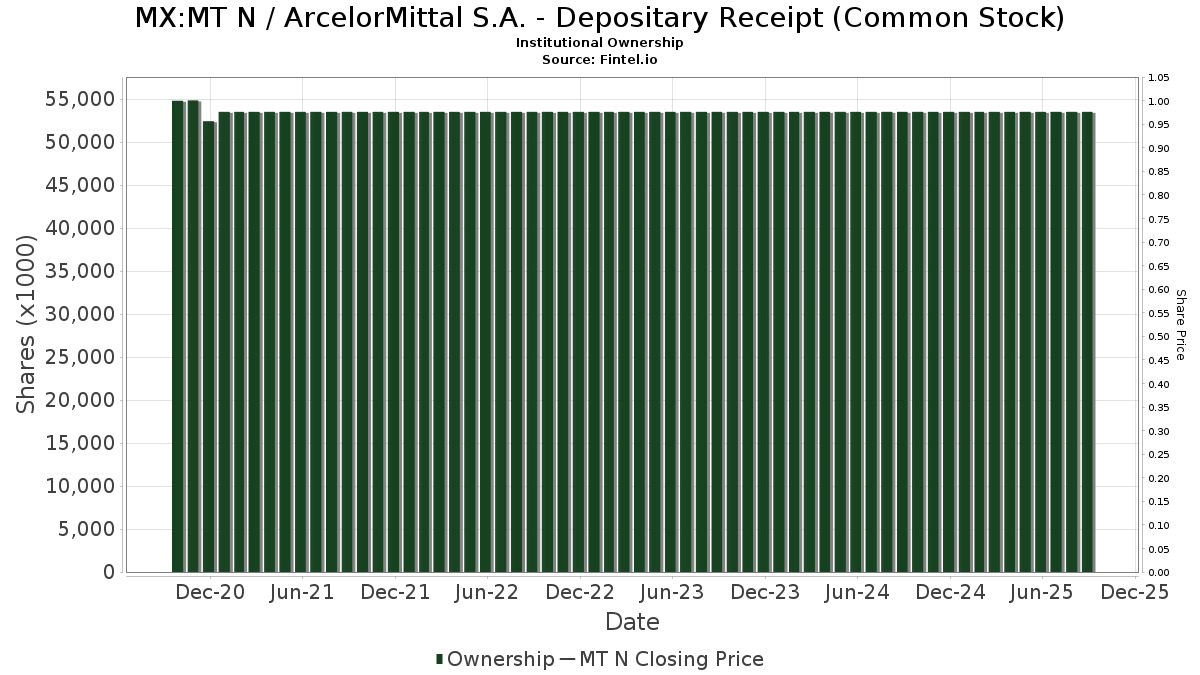
Institutionellt ägande och aktieägare
ArcelorMittal S.A. - Depositary Receipt (Common Stock) (MX:MT N) har 287 Institutionella ägare och aktieägare som har lämnat in 13D/G- eller 13F-formulär till Securities Exchange Commission (SEC). Dessa institut innehar totalt 29,531,750 aktier. Största aktieägare inkluderar Dimensional Fund Advisors Lp, BlackRock, Inc., Morgan Stanley, Maple Rock Capital Partners Inc., Millennium Management Llc, Bank of New York Mellon Corp, Fmr Llc, Goldman Sachs Group Inc, Connor, Clark & Lunn Investment Management Ltd., and Optiver Holding B.V. .
ArcelorMittal S.A. - Depositary Receipt (Common Stock) (BMV:MT N) Institutionell ägarstruktur visar institutioners och fonders nuvarande positioner i företaget, samt de senaste förändringarna i positionernas storlek. Större aktieägare kan vara enskilda investerare, fonder, hedgefonder eller institutioner. Bilaga 13D visar att investeraren äger (eller ägde) mer än 5% av företaget och avser (eller avsåg) att aktivt eftersträva en förändring av affärsstrategin. Schedule 13G indikerar en passiv investering på över 5%.
Fondsentimentets poäng
Fondsentimentet poängen(fka Ägarackumulation-poäng) visar vilka aktier som är mest köpta av fonder. Det är resultatet av en sofistikerad kvantitativ flerfaktormodell som identifierar företag med de högsta nivåerna av institutionell ackumulering. Poängsättningsmodellen använder en kombination av den totala ökningen av redovisade ägare, förändringarna i portföljallokeringarna för dessa ägare och andra mått. Siffran sträcker sig från 0 till 100, där högre siffror indikerar en högre nivå av ackumulering i förhållande till sina konkurrenter, och 50 är genomsnittet.
Uppdateringsfrekvens: Dagligen
Se Ownership Explorer, som innehåller en lista över de högst rankade företagen.
AI+ Ask Fintel’s AI assistant about ArcelorMittal S.A. - Depositary Receipt (Common Stock).
Select a question to share a public post with an AI-crafted answer.
Thinking of good questions…
13F- och NPORT-arkiveringar
Detaljer om 13F-arkiveringar är gratis. Detaljer om NP-arkiveringar kräver ett premiummedlemskap. Gröna rader indikerar nya positioner. Röda rader indikerar stängda positioner. Klicka på länk symbolen för att se hela transaktionshistoriken.
Uppgradera
för att låsa upp premiumdata och exportera till Excel ![]() .
.
| Fil Datum | Källa | Investerare | Typ | Genomsnittligt pris (beräknat) |
Aktier | Δ Aktier (%) |
Rapporterat värde (1000 USD) |
Δ Värde (%) |
Portföljallokering (%) |
|
|---|---|---|---|---|---|---|---|---|---|---|
| 2026-02-23 | 13F | Mv Capital Management, Inc. | 5 | 0 | ||||||
| 2025-11-14 | 13F | Squarepoint Ops LLC | Call | 0 | −100,00 | 0 | −100,00 | |||
| 2026-02-17 | 13F | Ancora Advisors, LLC | 17 | −95,38 | 1 | −100,00 | ||||
| 2026-02-17 | 13F | Caption Management, LLC | 0 | −100,00 | 0 | |||||
| 2025-11-14 | 13F | Squarepoint Ops LLC | 0 | −100,00 | 0 | −100,00 | ||||
| 2025-11-12 | 13F | Transce3nd, LLC | 0 | −100,00 | 0 | |||||
| 2026-04-06 | 13F | Highline Wealth Partners Llc | 206 | 0,00 | 11 | 11,11 | ||||
| 2026-01-16 | 13F | Empirical Financial Services, LLC d.b.a. Empirical Wealth Management | 5 182 | 236 | ||||||
| 2026-02-13 | 13F | Wells Fargo & Company/mn | 93 361 | −15,27 | 4 254 | 6,80 | ||||
| 2026-02-17 | 13F | Scientech Research LLC | 5 499 | 251 | ||||||
| 2026-04-24 | 13F | Retirement Systems of Alabama | 674 150 | 0,00 | 35 042 | 14,07 | ||||
| 2026-02-12 | 13F | Hrt Financial Lp | 143 783 | 51,92 | 7 | 100,00 | ||||
| 2026-02-13 | 13F | Stifel Financial Corp | 7 380 | 22,33 | 336 | 54,13 | ||||
| 2026-02-10 | 13F | Rothschild Investment Llc | 1 372 | 0,00 | 63 | 26,53 | ||||
| 2026-04-24 | 13F | Profund Advisors Llc | 10 610 | −13,47 | 552 | −1,25 | ||||
| 2026-02-12 | 13F | DRW Securities, LLC | 5 787 | 264 | ||||||
| 2026-02-05 | 13F | Phoenix Holdings Ltd. | 4 801 | 218 | ||||||
| 2026-02-06 | 13F | GPS Wealth Strategies Group, LLC | 0 | −100,00 | 0 | |||||
| 2026-02-19 | 13F | CI Private Wealth, LLC | 18 569 | −18,61 | 842 | 2,18 | ||||
| 2026-04-16 | 13F | Evolve Private Wealth, Llc | 42 597 | 4,85 | 2 214 | 19,61 | ||||
| 2026-02-11 | 13F | Cerity Partners LLC | 274 562 | 1,30 | 12 512 | 27,70 | ||||
| 2026-02-13 | 13F | American Century Companies Inc | 542 177 | 17,57 | 24 707 | 48,21 | ||||
| 2026-02-17 | 13F | Albar Capital Partners LLP | 160 151 | 7 298 | ||||||
| 2026-02-13 | 13F | State Street Corp | 57 383 | −16,18 | 2 615 | 5,66 | ||||
| 2026-04-10 | 13F | Auto-Owners Insurance Co | 8 066 | 0,00 | 419 | 14,17 | ||||
| 2026-02-13 | 13F | Causeway Capital Management Llc | 384 849 | −34,42 | 17 538 | −17,33 | ||||
| 2026-02-13 | 13F | SRS Capital Advisors, Inc. | 1 758 | −57,17 | 80 | −45,95 | ||||
| 2026-01-29 | 13F | Cherokee Insurance Co | 8 699 | 0,00 | 396 | 26,11 | ||||
| 2026-01-28 | 13F | CAPROCK Group, Inc. | 11 349 | 24,13 | 517 | 69,51 | ||||
| 2026-02-17 | 13F | Jones Financial Companies Lllp | 690 | −11,08 | 31 | 10,71 | ||||
| 2026-02-13 | 13F | Marshall Wace, Llp | 28 709 | 1 308 | ||||||
| 2026-02-17 | 13F | United Capital Financial Advisers, Llc | 13 411 | 12,08 | 611 | 41,44 | ||||
| 2026-02-17 | 13F | Susquehanna International Group, Llp | Call | 613 700 | 76,91 | 27 966 | 123,01 | |||
| 2026-02-13 | 13F | Ieq Capital, Llc | 15 329 | 101,33 | 699 | 153,82 | ||||
| 2026-02-11 | 13F | Zions Bancorporation, National Association /ut/ | 199 | 0,00 | 9 | 28,57 | ||||
| 2026-02-09 | 13F | Leavell Investment Management, Inc. | 10 297 | 469 | ||||||
| 2026-02-13 | 13F | Squarepoint Ops LLC | Put | 19 200 | 2,67 | 875 | 29,29 | |||
| 2026-02-11 | 13F | Jpmorgan Chase & Co | 168 721 | 327,74 | 7 689 | 439,51 | ||||
| 2025-10-30 | 13F | Twin Peaks Wealth Advisors, LLC | 0 | −100,00 | 0 | |||||
| 2026-02-10 | 13F | Godfrey Financial Associates, Inc. | 4 | 0 | ||||||
| 2026-02-06 | 13F | Vestmark Advisory Solutions, Inc. | 24 327 | 155,56 | 1 109 | 222,09 | ||||
| 2026-02-17 | 13F | Graham Capital Management, L.P. | 0 | −100,00 | 0 | |||||
| 2026-02-13 | 13F | Pathstone Holdings, LLC | 81 493 | −28,91 | 3 714 | −10,38 | ||||
| 2025-10-31 | 13F | Whittier Trust Co Of Nevada Inc | 0 | −100,00 | 0 | |||||
| 2026-02-11 | 13F | O'shaughnessy Asset Management, Llc | 40 856 | 34,29 | 1 862 | 69,34 | ||||
| 2026-01-30 | 13F | Catalytic Wealth RIA, LLC | 9 773 | −5,23 | 445 | 19,62 | ||||
| 2026-02-13 | 13F | Gts Securities Llc | 0 | −100,00 | 0 | |||||
| 2026-04-17 | 13F | CENTRAL TRUST Co | 15 | −21,05 | 1 | |||||
| 2026-04-21 | 13F | Nemes Rush Group LLC | 24 | 0,00 | 1 | 0,00 | ||||
| 2025-11-12 | 13F | NewSquare Capital LLC | 0 | −100,00 | 0 | |||||
| 2026-02-17 | 13F | Northern Trust Corp | 771 836 | −19,83 | 35 173 | 1,06 | ||||
| 2026-04-21 | 13F | Venturi Wealth Management, LLC | 7 882 | 77,96 | 410 | 103,48 | ||||
| 2026-02-10 | 13F | Envestnet Asset Management Inc | 159 572 | −32,85 | 7 272 | −15,36 | ||||
| 2026-02-17 | 13F | Susquehanna International Group, Llp | 14 817 | −95,12 | 675 | −93,84 | ||||
| 2026-02-17 | 13F | Susquehanna International Group, Llp | Put | 518 000 | 59,48 | 23 605 | 101,05 | |||
| 2026-03-04 | 13F | SHP Wealth Management | 90 | 4 | ||||||
| 2026-02-17 | 13F | Point72 Asset Management, L.P. | 562 933 | 25 653 | ||||||
| 2026-02-13 | 13F | Palisade Asset Management, LLC | 0 | −100,00 | 0 | |||||
| 2026-04-23 | 13F | Oppenheimer Asset Management Inc. | 14 372 | −32,85 | 747 | −23,38 | ||||
| 2026-02-13 | 13F | Caxton Associates Llp | 0 | −100,00 | 0 | |||||
| 2026-02-05 | 13F | Atria Investments Llc | 5 060 | −25,31 | 231 | −5,74 | ||||
| 2026-02-26 | 13F | TD Capital Management LLC | 8 | 0 | ||||||
| 2026-04-20 | 13F | Ritholtz Wealth Management | 19 853 | 20,87 | 1 032 | 37,83 | ||||
| 2026-02-13 | 13F | Recurrent Investment Advisors LLC | 14 669 | −72,57 | 574 | −64,91 | ||||
| 2026-02-12 | 13F | Jane Street Group, Llc | Call | 85 300 | −1,61 | 3 887 | 24,03 | |||
| 2026-02-12 | 13F | Jane Street Group, Llc | 4 497 | −88,13 | 205 | −85,11 | ||||
| 2025-11-12 | 13F | Quantbot Technologies LP | 0 | −100,00 | 0 | |||||
| 2026-02-12 | 13F | Jane Street Group, Llc | Put | 107 400 | 2,38 | 4 894 | 29,06 | |||
| 2026-02-17 | 13F | Cetera Investment Advisers | 18 386 | 1,04 | 838 | 27,40 | ||||
| 2026-02-19 | 13F | Invesco Ltd. | 19 785 | 239,83 | 902 | 329,05 | ||||
| 2026-02-09 | 13F | Knights of Columbus Asset Advisors LLC | 7 566 | 0,00 | 345 | 26,01 | ||||
| 2026-02-13 | 13F | Dymon Asia Capital (singapore) Pte. Ltd. | Put | 30 000 | 1 367 | |||||
| 2026-02-05 | 13F | May Hill Capital, LLC | 5 438 | 248 | ||||||
| 2026-02-12 | 13F | Integrated Quantitative Investments LLC | 0 | −100,00 | 0 | |||||
| 2026-02-13 | 13F | Dymon Asia Capital (singapore) Pte. Ltd. | Call | 30 000 | 1 367 | |||||
| 2026-01-20 | 13F | Cromwell Holdings LLC | 1 860 | 0,00 | 85 | 25,37 | ||||
| 2026-04-06 | 13F | GAMMA Investing LLC | 3 752 | 18,02 | 195 | 35,42 | ||||
| 2026-02-06 | 13F | EverSource Wealth Advisors, LLC | 3 561 | 19,18 | 162 | 50,00 | ||||
| 2026-04-10 | 13F | Abound Wealth Management | 2 | 0 | ||||||
| 2026-02-17 | 13F | Parallax Volatility Advisers, L.P. | 0 | −100,00 | 0 | |||||
| 2026-02-17 | 13F | Parallax Volatility Advisers, L.P. | Put | 0 | −100,00 | 0 | ||||
| 2026-04-15 | 13F | Archford Capital Strategies, LLC | 5 122 | −22,71 | 266 | −11,63 | ||||
| 2026-02-17 | 13F | Point72 Asset Management, L.P. | Call | 0 | −100,00 | 0 | ||||
| 2026-01-27 | 13F | CenterStar Asset Management, LLC | Put | 6 400 | −20,00 | 292 | 0,69 | |||
| 2026-02-17 | 13F | Millennium Management Llc | 140 485 | 688,36 | 6 402 | 893,94 | ||||
| 2026-01-27 | 13F | CenterStar Asset Management, LLC | Call | 16 500 | 752 | |||||
| 2026-02-17 | 13F | Millennium Management Llc | Put | 72 600 | 8,36 | 3 308 | 36,58 | |||
| 2026-02-17 | 13F | Two Sigma Investments, Lp | 10 422 | −76,71 | 475 | −70,69 | ||||
| 2026-02-10 | 13F | Goldman Sachs Group Inc | 1 297 778 | 1,32 | 59 140 | 27,72 | ||||
| 2026-02-17 | 13F | SummitTX Capital, L.P. | 151 796 | 81,84 | 6 917 | 129,27 | ||||
| 2026-02-10 | 13F | Goldman Sachs Group Inc | Call | 130 000 | 0,00 | 5 924 | 26,07 | |||
| 2026-02-17 | 13F | Nomura Holdings Inc | Call | 0 | −100,00 | 0 | ||||
| 2026-02-10 | 13F | Goldman Sachs Group Inc | Put | 130 000 | 0,00 | 5 924 | 26,07 | |||
| 2026-04-24 | 13F | UMA Financial Services, Inc. | 7 | 0,00 | 0 | |||||
| 2026-02-13 | 13F | Dymon Asia Capital (singapore) Pte. Ltd. | 38 346 | 1 747 | ||||||
| 2026-04-09 | 13F | Moody National Bank Trust Division | 0 | −100,00 | 0 | |||||
| 2026-02-13 | 13F | C M Bidwell & Associates Ltd | 238 | 0,00 | 11 | 25,00 | ||||
| 2026-04-22 | 13F | Janney Montgomery Scott LLC | 4 700 | −45,61 | 0 | |||||
| 2026-04-20 | 13F | Jfs Wealth Advisors, Llc | 162 | 0,00 | 8 | 14,29 | ||||
| 2026-02-10 | 13F/A | Northwestern Mutual Wealth Management Co | 530 | −1,49 | 24 | 26,32 | ||||
| 2026-04-07 | 13F | Retirement Wealth Solutions LLC | 169 | −3,98 | 9 | 0,00 | ||||
| 2026-02-10 | 13F | Connor, Clark & Lunn Investment Management Ltd. | 884 661 | −46,25 | 40 314 | −32,25 | ||||
| 2025-11-06 | 13F | Abc Arbitrage Sa | 0 | −100,00 | 0 | |||||
| 2026-01-23 | 13F | Assetmark, Inc | 3 197 | −10,10 | 146 | 13,28 | ||||
| 2026-01-22 | 13F | Harwood Advisory Group, LLC | 24 706 | 1 126 | ||||||
| 2026-02-13 | 13F | Senator Investment Group LP | 580 000 | 26 431 | ||||||
| 2026-04-13 | 13F | Highland Capital Management, Llc | 20 127 | −0,25 | 1 046 | 13,82 | ||||
| 2026-02-20 | 13F | Kovitz Investment Group Partners, LLC | 0 | −100,00 | 0 | |||||
| 2026-02-17 | 13F | Mercer Global Advisors Inc /adv | 89 543 | 3,51 | 4 080 | 30,48 | ||||
| 2026-02-13 | 13F | Rhumbline Advisers | 6 033 | 0,00 | 275 | 25,69 | ||||
| 2026-04-13 | 13F | Fractal Investments LLC | 4 800 | 0,00 | 250 | 14,22 | ||||
| 2026-02-12 | 13F | Renaissance Technologies Llc | 121 171 | −66,15 | 5 522 | −57,33 | ||||
| 2026-04-24 | 13F | Root Financial Partners, LLC | 109 | 7,92 | 6 | 25,00 | ||||
| 2026-04-27 | 13F | Ethic Inc. | 4 192 | 218 | ||||||
| 2026-02-13 | 13F | JustInvest LLC | 56 879 | −18,53 | 2 592 | 2,65 | ||||
| 2026-02-10 | 13F | Natixis Advisors, L.p. | 46 487 | −46,07 | 2 | −33,33 | ||||
| 2026-02-17 | 13F | Schonfeld Strategic Advisors LLC | 0 | −100,00 | 0 | |||||
| 2026-02-13 | 13F | Walleye Capital LLC | Put | 161 100 | 546,99 | 7 341 | 715,67 | |||
| 2026-04-20 | 13F | CWA Asset Management Group, LLC | 0 | −100,00 | 0 | |||||
| 2026-02-09 | 13F | Hantz Financial Services, Inc. | 26 364 | 50,16 | 1 | |||||
| 2026-02-13 | 13F | Walleye Capital LLC | 10 800 | −47,49 | 492 | −33,78 | ||||
| 2026-02-13 | 13F | Walleye Capital LLC | Call | 64 600 | 68,67 | 2 944 | 112,64 | |||
| 2025-11-10 | 13F | Telemark Asset Management, LLC | 0 | −100,00 | 0 | −100,00 | ||||
| 2026-02-06 | 13F | Pnc Financial Services Group, Inc. | 10 490 | −2,47 | 478 | 23,20 | ||||
| 2026-02-19 | 13F | Atomi Financial Group, Inc. | 5 087 | 232 | ||||||
| 2026-02-17 | 13F | Engineers Gate Manager LP | 0 | −100,00 | 0 | |||||
| 2026-04-15 | 13F | Merit Financial Group, LLC | 8 815 | −1,00 | 458 | 13,09 | ||||
| 2026-02-17 | 13F | Keebeck Wealth Management, LLC | 10 533 | 1,57 | 480 | 28,07 | ||||
| 2026-02-12 | 13F | Principal Securities, Inc. | 0 | −100,00 | 0 | −100,00 | ||||
| 2026-02-17 | 13F | Laird Norton Trust Company, Llc | 16 682 | 760 | ||||||
| 2026-01-23 | 13F | Rsm Us Wealth Management Llc | 5 437 | −9,86 | 247 | 13,30 | ||||
| 2026-02-11 | 13F | Twin Tree Management, LP | 44 251 | 139,65 | 2 017 | 202,25 | ||||
| 2026-02-11 | 13F | Twin Tree Management, LP | Call | 100 | −99,94 | 5 | −99,93 | |||
| 2026-02-11 | 13F | Twin Tree Management, LP | Put | 50 500 | 2 301 | |||||
| 2026-01-30 | 13F | American Capital Advisory, LLC | 8 | 0,00 | 0 | |||||
| 2025-11-14 | 13F | Old Mission Capital Llc | 0 | −100,00 | 0 | |||||
| 2026-01-26 | 13F | Private Trust Co Na | 43 | 2 | ||||||
| 2026-02-06 | 13F | Larson Financial Group LLC | 41 | 28,12 | 2 | 0,00 | ||||
| 2025-11-14 | 13F | ICONIQ Capital, LLC | 0 | −100,00 | 0 | |||||
| 2026-02-02 | 13F | Cornerstone Planning Group LLC | 217 | 9,60 | 12 | 71,43 | ||||
| 2026-04-08 | 13F | Grove Bank & Trust | 471 | 2,39 | 24 | 20,00 | ||||
| 2026-02-17 | 13F | SageView Advisory Group, LLC | 148 | 7 | ||||||
| 2026-04-27 | 13F | Td Private Client Wealth Llc | 1 093 | 747,29 | 57 | 1 020,00 | ||||
| 2026-02-17 | 13F | Fmr Llc | 1 376 804 | 4,32 | 62 741 | 31,51 | ||||
| 2026-02-11 | 13F | Parallel Advisors, LLC | 2 455 | 16,41 | 112 | 46,05 | ||||
| 2026-04-15 | 13F | Trust Co Of Toledo Na /oh/ | 8 915 | −12,62 | 463 | −0,22 | ||||
| 2026-04-21 | 13F | Aaron Wealth Advisors LLC | 5 671 | 4,86 | 295 | 19,51 | ||||
| 2026-02-13 | 13F | Icon Advisers Inc/co | 27 000 | 1 230 | ||||||
| 2026-01-26 | 13F | Cwm, Llc | 1 945 | 6,52 | 0 | |||||
| 2026-02-13 | 13F | Colony Group, LLC | 14 503 | 146,52 | 661 | 194,64 | ||||
| 2026-02-03 | 13F | Sequoia Financial Advisors, LLC | 18 806 | 12,51 | 857 | 41,72 | ||||
| 2026-02-12 | 13F | Skopos Labs, Inc. | 33 799 | 249,85 | 1 539 | 411,30 | ||||
| 2025-10-27 | 13F | First Horizon Corp | 0 | −100,00 | 0 | |||||
| 2026-04-13 | 13F | IFP Advisors, Inc | 334 | 0,00 | 17 | 13,33 | ||||
| 2026-02-12 | 13F | Campbell & CO Investment Adviser LLC | 4 948 | 225 | ||||||
| 2026-01-28 | 13F | WPG Advisers, LLC | 353 | −14,94 | 16 | 6,67 | ||||
| 2026-02-12 | 13F | Steward Partners Investment Advisory, Llc | 351 | 0,00 | 16 | 25,00 | ||||
| 2026-02-17 | 13F | Qube Research & Technologies Ltd | 0 | −100,00 | 0 | |||||
| 2026-02-13 | 13F | Van Eck Associates Corp | 638 783 | −25,34 | 29 | −3,33 | ||||
| 2026-01-30 | 13F | Us Bancorp \de\ | 17 047 | 2,32 | 777 | 28,90 | ||||
| 2026-02-17 | 13F | Russell Investments Group, Ltd. | 38 154 | −0,35 | 1 739 | 25,58 | ||||
| 2025-10-31 | 13F | Whittier Trust Co | 0 | −100,00 | 0 | −100,00 | ||||
| 2026-02-10 | 13F | Nomura Asset Management Co Ltd | 0 | 0 | ||||||
| 2025-11-14 | 13F | Bridgefront Capital, LLC | 0 | −100,00 | 0 | −100,00 | ||||
| 2026-02-10 | 13F | Savant Capital, LLC | 0 | −100,00 | 0 | |||||
| 2026-02-17 | 13F | GeoWealth Management, LLC | 9 804 | 13,51 | 447 | 42,95 | ||||
| 2026-04-07 | 13F | Farther Finance Advisors, LLC | 4 115 | 24,17 | 222 | 47,02 | ||||
| 2025-11-14 | 13F | Holocene Advisors, LP | 0 | −100,00 | 0 | |||||
| 2026-02-17 | 13F | Aqr Capital Management Llc | 235 583 | 62,15 | 10 736 | 104,40 | ||||
| 2026-02-11 | 13F | West Family Investments, Inc. | 6 624 | 0,00 | 302 | 25,94 | ||||
| 2026-04-20 | 13F | Contravisory Investment Management, Inc. | 7 666 | −14,45 | 398 | −2,45 | ||||
| 2026-02-17 | 13F | Wellington Management Group Llp | 223 335 | 19,10 | 10 177 | 50,15 | ||||
| 2026-02-13 | 13F | Marnell Management LLC | 14 888 | 678 | ||||||
| 2026-02-13 | 13F | Umb Bank N A/mo | 222 | 0,00 | 10 | 25,00 | ||||
| 2026-04-08 | 13F | Legacy Wealth Asset Management, LLC | 22 489 | −4,46 | 1 169 | 8,96 | ||||
| 2026-02-11 | 13F | LPL Financial LLC | 72 047 | 4,19 | 3 283 | 31,37 | ||||
| 2026-02-14 | 13F | Rockefeller Capital Management L.P. | 4 383 | 27,52 | 200 | 60,48 | ||||
| 2026-02-13 | 13F | Morgan Stanley | 1 718 345 | −3,20 | 78 305 | 22,03 | ||||
| 2026-02-13 | 13F | Johnson Investment Counsel Inc | 0 | −100,00 | 0 | |||||
| 2026-04-24 | 13F | Yousif Capital Management, Llc | 7 223 | −47,56 | 375 | −44,20 | ||||
| 2026-02-13 | 13F | First Trust Advisors Lp | 14 718 | 19,53 | 671 | 50,56 | ||||
| 2026-02-05 | 13F | Allworth Financial LP | 1 126 | 91,50 | 51 | 142,86 | ||||
| 2026-02-12 | 13F | New York State Common Retirement Fund | 0 | −100,00 | 0 | |||||
| 2026-02-13 | 13F | Centerpoint Advisors, LLC | 0 | −100,00 | 0 | |||||
| 2026-02-03 | 13F | Mitsubishi UFJ Kokusai Asset Management Co., Ltd. | 7 823 | −15,15 | 369 | 10,81 | ||||
| 2026-02-17 | 13F | Tudor Investment Corp Et Al | Call | 5 300 | 242 | |||||
| 2026-02-17 | 13F | Bank Of America Corp /de/ | 841 885 | −11,19 | 38 365 | 11,96 | ||||
| 2026-01-28 | 13F | Salomon & Ludwin, LLC | 326 | 0,00 | 15 | 25,00 | ||||
| 2025-10-28 | 13F | BRYN MAWR TRUST Co | 517 | 0,00 | 19 | 12,50 | ||||
| 2026-02-13 | 13F | Verition Fund Management LLC | Call | 8 200 | 0,00 | 374 | 26,01 | |||
| 2026-01-27 | 13F | TD Waterhouse Canada Inc. | 2 141 | 11,22 | 98 | 32,88 | ||||
| 2026-02-13 | 13F | Verition Fund Management LLC | Put | 46 100 | −10,31 | 2 101 | 13,02 | |||
| 2026-04-06 | 13F | Rosenberg Matthew Hamilton | 4 800 | 0,00 | 250 | 14,22 | ||||
| 2026-02-13 | 13F | Pinnacle Wealth Planning Services, Inc. | 3 390 | 154 | ||||||
| 2026-02-24 | 13F | DGS Capital Management, LLC | 12 370 | 78,47 | 564 | 125,20 | ||||
| 2026-02-18 | 13F | GWM Advisors LLC | 12 752 | 581 | ||||||
| 2026-02-06 | 13F | HighTower Advisors, LLC | 9 323 | −21,99 | 425 | −1,85 | ||||
| 2026-01-27 | 13F | Evergreen Capital Management Llc | 17 744 | 13,98 | 809 | 43,77 | ||||
| 2026-02-17 | 13F | Prelude Capital Management, Llc | 6 100 | −6,30 | 278 | 17,87 | ||||
| 2026-02-10 | 13F | Bnp Paribas Arbitrage, Sa | 7 749 | −97,88 | 353 | −97,33 | ||||
| 2026-02-10 | 13F | Principia Wealth Advisory, LLC | 32 | 6,67 | 1 | 0,00 | ||||
| 2026-04-14 | 13F | Corecam Pte. Ltd. | Call | 0 | −100,00 | 0 | ||||
| 2026-01-28 | 13F | Geneos Wealth Management Inc. | 26 | 0,00 | 1 | |||||
| 2026-01-26 | 13F | Covenant Partners, LLC | 12 834 | 0,00 | 585 | 26,13 | ||||
| 2026-04-23 | 13F | North Star Investment Management Corp. | 32 | 113,33 | 2 | |||||
| 2025-11-13 | 13F | Clear Street Markets Llc | 0 | −100,00 | 0 | −100,00 | ||||
| 2026-02-17 | 13F | Guggenheim Capital Llc | 7 443 | −16,60 | 339 | 5,28 | ||||
| 2025-11-14 | 13F | Cubist Systematic Strategies, LLC | 0 | −100,00 | 0 | |||||
| 2026-04-15 | 13F | Bayforest Capital Ltd | 52 | 3 | ||||||
| 2026-02-17 | 13F | Creative Planning | 118 013 | 28,98 | 5 378 | 62,59 | ||||
| 2026-02-11 | 13F | Syon Capital Llc | 10 592 | 9,64 | 483 | 38,11 | ||||
| 2026-02-02 | 13F | Montag A & Associates Inc | 0 | −100,00 | 0 | |||||
| 2026-02-13 | 13F | Walleye Trading LLC | 86 120 | −13,01 | 3 924 | 9,67 | ||||
| 2026-04-27 | 13F | Qrg Capital Management, Inc. | 97 537 | −2,02 | 5 070 | 11,75 | ||||
| 2026-02-13 | 13F | Walleye Trading LLC | Put | 370 000 | 18,48 | 16 861 | 49,35 | |||
| 2026-02-13 | 13F | Walleye Trading LLC | Call | 214 800 | 66,51 | 9 788 | 109,91 | |||
| 2026-02-12 | 13F | JPL Wealth Management, LLC | 0 | −100,00 | 0 | −100,00 | ||||
| 2026-04-21 | 13F | Financial Consulate, Inc | 367 | 43,92 | 19 | 72,73 | ||||
| 2026-02-23 | 13F | Beaird Harris Wealth Management, LLC | 60 | 0,00 | 3 | 0,00 | ||||
| 2026-03-26 | 13F/A | Peak6 Llc | 0 | −100,00 | 0 | −100,00 | ||||
| 2025-11-14 | 13F | Wetherby Asset Management Inc | 10 520 | 1,09 | 380 | 15,85 | ||||
| 2026-04-20 | 13F | Ronald Blue Trust, Inc. | 1 598 | −15,40 | 83 | −3,49 | ||||
| 2026-02-13 | 13F | Kilter Group LLC | 95 | 150,00 | 4 | 300,00 | ||||
| 2026-02-17 | 13F | Man Group plc | 226 995 | −29,98 | 10 344 | −11,73 | ||||
| 2026-02-17 | 13F | Boreal Capital Management LLC | 313 | 0,00 | 14 | 27,27 | ||||
| 2026-01-30 | 13F/A | M&t Bank Corp | 5 651 | −1,33 | 257 | 24,76 | ||||
| 2026-01-27 | 13F | WealthCollab, LLC | 41 | 0,00 | 2 | 0,00 | ||||
| 2026-02-19 | 13F/A | Axxcess Wealth Management, Llc | 24 376 | 1 111 | ||||||
| 2026-04-27 | 13F | Sound Income Strategies, LLC | 26 | 0,00 | 1 | 0,00 | ||||
| 2026-01-22 | 13F | Bear Mountain Capital, Inc. | 0 | −100,00 | 0 | |||||
| 2026-02-12 | 13F | Bank Of Montreal /can/ | 139 680 | −1,44 | 6 365 | 24,27 | ||||
| 2026-02-05 | 13F | HighMark Wealth Management LLC | 91 | 16,67 | 4 | 100,00 | ||||
| 2026-04-02 | 13F | Ares Financial Consulting, LLC | 128 | 0,00 | 7 | 20,00 | ||||
| 2026-02-17 | 13F | Royal Bank Of Canada | 824 528 | −12,30 | 37 573 | 10,55 | ||||
| 2026-04-20 | 13F | Concurrent Investment Advisors, LLC | 0 | −100,00 | 0 | −100,00 | ||||
| 2026-02-13 | 13F | Verition Fund Management LLC | 0 | −100,00 | 0 | −100,00 | ||||
| 2026-04-21 | 13F | Vise Technologies, Inc. | 18 385 | 0,00 | 838 | 0,00 | ||||
| 2026-04-23 | 13F | Forum Financial Management, LP | 0 | −100,00 | 0 | |||||
| 2026-04-23 | 13F | SJS Investment Consulting Inc. | 293 | 7,33 | 15 | 25,00 | ||||
| 2026-04-07 | 13F | Park Avenue Securities Llc | 11 745 | −17,52 | 1 | |||||
| 2026-02-11 | 13F | GW&K Investment Management, LLC | 78 | 0 | ||||||
| 2026-02-13 | 13F | Barclays Plc | 11 542 | 6 420,90 | 526 | 8 650,00 | ||||
| 2026-02-13 | 13F | Mariner, LLC | 35 674 | 4,50 | 1 625 | 31,69 | ||||
| 2026-02-03 | 13F | NewEdge Wealth, LLC | 7 994 | 29,69 | 364 | 58,26 | ||||
| 2026-04-22 | 13F | Sterling Capital Management LLC | 3 261 | −41,19 | 170 | −32,94 | ||||
| 2026-03-24 | 13F/A | Barclays Plc | Put | 0 | −100,00 | 0 | −100,00 | |||
| 2026-02-06 | 13F | Cullen/frost Bankers, Inc. | 15 | 1 | ||||||
| 2026-02-12 | 13F | Brown Brothers Harriman & Co | 444 | 100,90 | 20 | 185,71 | ||||
| 2025-11-14 | 13F | Wolverine Trading, Llc | 26 501 | −16,96 | 967 | −3,01 | ||||
| 2025-11-14 | 13F | Wolverine Trading, Llc | Call | 94 900 | 82,15 | 3 464 | 112,71 | |||
| 2026-02-09 | 13F | MMCAP International Inc. SPC | 91 427 | 4 166 | ||||||
| 2025-11-14 | 13F | Wolverine Trading, Llc | Put | 115 800 | 40,02 | 4 227 | 63,48 | |||
| 2026-02-11 | 13F | Dorsey & Whitney Trust CO LLC | 7 143 | 6,69 | 326 | 34,30 | ||||
| 2026-02-06 | 13F | Bare Financial Services, Inc | 84 | 0,00 | 4 | 0,00 | ||||
| 2026-02-17 | 13F | Arrow Capital Pty Ltd | 0 | −100,00 | 0 | −100,00 | ||||
| 2026-04-08 | 13F | Wealth Enhancement Advisory Services, Llc | 10 070 | −35,03 | 533 | −27,42 | ||||
| 2026-02-09 | 13F | Harbour Investments, Inc. | 383 | 35,34 | 17 | 70,00 | ||||
| 2026-04-24 | 13F | Private Advisor Group, LLC | 15 788 | 0,95 | 821 | 15,17 | ||||
| 2026-02-13 | 13F | Kestra Advisory Services, LLC | 2 983 | 136 | ||||||
| 2026-02-17 | 13F | Steadfast Capital Management Lp | 595 047 | 27 116 | ||||||
| 2026-02-17 | 13F | Blackstone Group Inc | 50 984 | 74,17 | 2 323 | 119,57 | ||||
| 2026-02-13 | 13F | Sei Investments Co | 160 675 | −7,62 | 7 322 | 16,43 | ||||
| 2026-02-13 | 13F | Citigroup Inc | 32 176 | −38,70 | 1 466 | −22,72 | ||||
| 2026-02-13 | 13F | Citigroup Inc | Call | 291 400 | 22,08 | 13 279 | 53,89 | |||
| 2026-02-12 | 13F | BlackRock, Inc. | 1 877 411 | 2,47 | 85 554 | 29,18 | ||||
| 2026-02-09 | 13F | Huntington National Bank | 24 | 1 | ||||||
| 2026-02-12 | 13F | Brinker Capital Investments, LLC | 7 722 | −11,26 | 352 | 11,78 | ||||
| 2026-04-24 | 13F | Pzena Investment Management Llc | 18 409 | −46,60 | 957 | −39,15 | ||||
| 2026-01-28 | 13F | Legacy Capital Group California, Inc. | 8 878 | −0,46 | 405 | 25,47 | ||||
| 2026-02-10 | 13F | Dynasty Wealth Management, Llc | 14 666 | 5,90 | 668 | 33,60 | ||||
| 2026-02-03 | 13F | Manning & Napier Advisors Llc | 186 | 8 | ||||||
| 2026-02-17 | 13F | D. E. Shaw & Co., Inc. | Put | 75 000 | 0,00 | 3 418 | 26,04 | |||
| 2026-02-17 | 13F | D. E. Shaw & Co., Inc. | 267 475 | 99,37 | 12 189 | 151,35 | ||||
| 2026-02-12 | 13F | Wealthspire Advisors, LLC | 0 | −100,00 | 0 | |||||
| 2026-02-13 | 13F | MAI Capital Management | 677 | 7 422,22 | 31 | |||||
| 2026-04-20 | 13F | Kestra Private Wealth Services, Llc | 33 924 | 2,40 | 1 763 | 16,83 | ||||
| 2026-02-12 | 13F | Barometer Capital Management Inc. | 481 960 | 11 189,76 | 13 133 | 8 427,92 | ||||
| 2026-04-27 | 13F | Truist Financial Corp | 4 512 | −9,60 | 235 | 3,08 | ||||
| 2026-02-13 | 13F | Impala Asset Management LLC | 158 866 | 7 281 | ||||||
| 2026-02-17 | 13F | Raymond James Financial Inc | 100 883 | −7,02 | 4 596 | 17,19 | ||||
| 2026-02-17 | 13F | Dv Equities, Llc | 156 745 | 7 200 | ||||||
| 2026-02-10 | 13F | BW Gestao de Investimentos Ltda. | 200 000 | 9 114 | ||||||
| 2026-02-17 | 13F | Voloridge Investment Management, Llc | 0 | −100,00 | 0 | |||||
| 2026-02-17 | 13F | Ameriprise Financial Inc | 18 966 | −0,62 | 864 | 25,40 | ||||
| 2026-02-17 | 13F | Citadel Advisors Llc | Put | 439 100 | 65,39 | 20 010 | 108,49 | |||
| 2026-02-17 | 13F | Citadel Advisors Llc | Call | 114 000 | −12,04 | 5 195 | 10,86 | |||
| 2026-02-17 | 13F | Citadel Advisors Llc | 535 637 | −8,87 | 24 409 | 14,88 | ||||
| 2026-02-12 | 13F | Federation des caisses Desjardins du Quebec | 5 031 | 0,40 | 229 | 26,52 | ||||
| 2026-02-17 | 13F | Castle Hook Partners LP | 130 669 | 5 955 | ||||||
| 2026-02-13 | 13F | Corient IA LLC | 5 970 | −40,30 | 272 | −24,65 | ||||
| 2026-02-11 | 13F | Capital Wealth Planning, LLC | 235 750 | 156,27 | 11 127 | 234,65 | ||||
| 2025-10-28 | 13F | Rakuten Securities, Inc. | 0 | −100,00 | 0 | |||||
| 2026-04-24 | 13F | Optas, LLC | 5 671 | 0,12 | 295 | 13,95 | ||||
| 2026-02-17 | 13F | Boothbay Fund Management, Llc | 104 913 | −8,68 | 4 781 | 15,10 | ||||
| 2026-02-13 | 13F | Caitong International Asset Management Co., Ltd | 0 | −100,00 | 0 | |||||
| 2026-02-13 | 13F | Atlas Capital Advisors Llc | 2 025 | 25,62 | 92 | 84,00 | ||||
| 2026-02-17 | 13F | Millennium Management Llc | Call | 1 601 100 | −8,23 | 72 962 | 15,68 | |||
| 2026-02-17 | 13F | Signature Equity Partners, LLC | 148 | 7 | ||||||
| 2025-11-14 | 13F | Moore Capital Management, Lp | 0 | −100,00 | 0 | |||||
| 2026-04-06 | 13F | Versant Capital Management, Inc | 8 429 | −7,52 | 438 | 5,54 | ||||
| 2026-02-11 | 13F | Group One Trading, L.p. | Call | 50 400 | −52,54 | 2 297 | −40,19 | |||
| 2026-02-11 | 13F | Group One Trading, L.p. | Put | 98 800 | −1,59 | 4 502 | 24,06 | |||
| 2026-02-05 | 13F | AlphaCore Capital LLC | 26 430 | −17,13 | 1 204 | 4,51 | ||||
| 2026-02-11 | 13F | Group One Trading, L.p. | 28 744 | 1 310 | ||||||
| 2026-02-13 | 13F | Transamerica Financial Advisors, Inc. | 3 | 0 | ||||||
| 2025-11-14 | 13F | Woodline Partners LP | 0 | −100,00 | 0 | |||||
| 2026-02-06 | 13F | Leonteq Securities AG | 0 | −100,00 | 0 | |||||
| 2026-02-18 | 13F | Vident Advisory, LLC | 20 201 | −2,23 | 921 | 23,32 | ||||
| 2026-02-17 | 13F | Advisory Services Network, LLC | 0 | −100,00 | 0 | |||||
| 2026-02-10 | 13F | Bnp Paribas Arbitrage, Sa | Call | 0 | −100,00 | 0 | −100,00 | |||
| 2026-02-18 | 13F/A | Robotti Robert | 338 710 | −0,06 | 15 435 | 25,99 | ||||
| 2026-02-13 | 13F | Parkside Financial Bank & Trust | 269 | 0,00 | 12 | 33,33 | ||||
| 2026-02-05 | 13F | Elyxium Wealth, LLC | 253 | 12 | ||||||
| 2026-02-17 | 13F | Covalis Capital Llp | 0 | −100,00 | 0 | |||||
| 2026-02-17 | 13F | XTX Topco Ltd | 35 277 | 1 608 | ||||||
| 2026-02-11 | 13F | IMA Wealth, Inc. | 77 | 4 | ||||||
| 2026-02-17 | 13F | Quantinno Capital Management LP | 300 633 | 30,83 | 13 700 | 64,91 | ||||
| 2026-02-12 | 13F | Dimensional Fund Advisors Lp | 3 220 992 | 1,56 | 146 780 | 28,03 | ||||
| 2026-02-03 | 13F | Gallacher Capital Management LLC | 16 341 | 0,15 | 745 | 26,32 | ||||
| 2026-02-06 | 13F | Global Retirement Partners, LLC | 3 764 | 55,09 | 172 | 96,55 | ||||
| 2026-02-17 | 13F | Massar Capital Management, LP | 10 739 | 489 | ||||||
| 2026-02-10 | 13F | Bruce G. Allen Investments, LLC | 397 | 0,00 | 18 | 28,57 | ||||
| 2025-11-13 | 13F | Glenmede Investment Management, LP | 11 212 | −10,73 | 405 | 2,27 | ||||
| 2026-04-13 | 13F | Mather Group, Llc. | 149 | 8 | ||||||
| 2026-01-29 | 13F | UBS Group AG | 221 356 | −81,26 | 10 087 | −76,38 | ||||
| 2025-11-13 | 13F | Capital Fund Management S.a. | 0 | −100,00 | 0 | −100,00 | ||||
| 2026-02-17 | 13F | SALT Holding Corp. | 19 700 | 0,00 | 898 | 25,98 | ||||
| 2026-04-13 | 13F | True Wealth Design, LLC | 1 034 | 29,41 | 54 | 47,22 | ||||
| 2026-02-05 | 13F | Bessemer Group Inc | 732 | 47,28 | 0 | |||||
| 2026-04-03 | 13F | Investors Research Corp | 0 | −100,00 | 0 | |||||
| 2026-04-17 | 13F | Bell Investment Advisors, Inc | 86 | 0,00 | 4 | 33,33 | ||||
| 2026-01-23 | 13F | Westside Investment Management, Inc. | 282 | 0,00 | 13 | 30,00 | ||||
| 2026-02-13 | 13F | SYM FINANCIAL Corp | 6 244 | 7,05 | 285 | 35,24 | ||||
| 2026-02-13 | 13F | North Ridge Wealth Advisors, Inc. | 0 | −100,00 | 0 | |||||
| 2026-02-17 | 13F | Hartree Partners, LP | 5 224 | 238 | ||||||
| 2025-11-14 | 13F | Binnacle Investments Inc | 89 | −21,93 | 3 | 0,00 | ||||
| 2026-02-17 | 13F | Tower Research Capital LLC (TRC) | 2 696 | −91,72 | 123 | −89,63 | ||||
| 2026-02-11 | 13F | Simplex Trading, Llc | Put | 102 900 | 1,58 | 4 689 | 156 200,00 | |||
| 2026-04-17 | 13F | AdvisorNet Financial, Inc | 157 | 0,00 | 8 | 14,29 | ||||
| 2026-02-11 | 13F | Simplex Trading, Llc | Call | 95 600 | −67,20 | 4 356 | 43 460,00 | |||
| 2026-02-12 | 13F | Johnson Financial Group, Inc. | 0 | −100,00 | 0 | |||||
| 2026-02-12 | 13F | Hollencrest Capital Management | 20 | 0,00 | 1 | |||||
| 2026-04-16 | 13F | SG Americas Securities, LLC | Call | 0 | −100,00 | 0 | ||||
| 2026-04-16 | 13F | SG Americas Securities, LLC | 0 | −100,00 | 0 | |||||
| 2026-04-13 | 13F | St Germain D J Co Inc | 19 | 0,00 | 1 | |||||
| 2026-04-24 | 13F | Ninety One UK Ltd | 0 | −100,00 | 0 | |||||
| 2026-02-17 | 13F | Balyasny Asset Management Llc | 280 869 | −23,88 | 12 799 | −4,04 | ||||
| 2026-02-10 | 13F | State of Wyoming | 0 | −100,00 | 0 | |||||
| 2026-02-12 | 13F | Quadrant Capital Group Llc | 23 545 | −0,78 | 1 073 | 25,09 | ||||
| 2026-02-13 | 13F | Smartleaf Asset Management LLC | 6 753 | −8,40 | 307 | 14,13 | ||||
| 2026-01-21 | 13F | Newbridge Financial Services Group, Inc. | 33 | 0,00 | 2 | 0,00 | ||||
| 2026-02-12 | 13F | CIBC Private Wealth Group, LLC | 1 146 | 126,48 | 52 | 188,89 | ||||
| 2025-11-13 | 13F | Riggs Asset Managment Co. Inc. | 0 | −100,00 | 0 | |||||
| 2026-02-12 | 13F | Penserra Capital Management LLC | 48 | −27,27 | 0 | |||||
| 2026-04-08 | 13F | Amanah Holdings Trust | 148 000 | 0,00 | 7 693 | 14,07 | ||||
| 2026-04-07 | 13F | Signaturefd, Llc | 34 553 | 1,55 | 1 796 | 15,87 | ||||
| 2026-04-22 | 13F | JNBA Financial Advisors | 22 | 0,00 | 1 | 0,00 | ||||
| 2025-11-14 | 13F | Texas Permanent School Fund | 0 | −100,00 | 0 | −100,00 | ||||
| 2026-02-13 | 13F | National Bank Of Canada /fi/ | 770 | −20,78 | 35 | 0,00 | ||||
| 2026-02-09 | 13F | Annis Gardner Whiting Capital Advisors, LLC | 149 | 7 | ||||||
| 2026-03-12 | 13F/A | Peak6 Llc | Put | 244 900 | 7,04 | 11 160 | 34,93 | |||
| 2026-02-02 | 13F | Fifth Third Bancorp | 4 933 | 0,35 | 225 | 26,55 | ||||
| 2026-04-13 | 13F | Creative Financial Designs Inc /adv | 123 | 0,00 | 6 | 20,00 | ||||
| 2026-02-10 | 13F | Sivia Capital Partners, LLC | 9 942 | 453 | ||||||
| 2026-03-24 | 13F/A | Barclays Plc | Call | 0 | −100,00 | 0 | −100,00 | |||
| 2026-02-17 | 13F | Mork Capital Management, LLC | 43 200 | 0,00 | 1 969 | 26,07 | ||||
| 2026-01-29 | 13F | IMC-Chicago, LLC | Call | 48 400 | 77,94 | 2 206 | 124,31 | |||
| 2025-11-06 | 13F | Whipplewood Advisors, LLC | 0 | −100,00 | 0 | |||||
| 2026-02-10 | 13F | Bank of New York Mellon Corp | 1 480 754 | −23,91 | 67 478 | −4,08 | ||||
| 2026-02-10 | 13F | Private Wealth Asset Management, LLC | 28 | 0,00 | 1 | 0,00 | ||||
| 2026-02-17 | 13F | Maple Rock Capital Partners Inc. | 1 630 600 | 42,39 | 74 306 | 79,49 | ||||
| 2026-02-17 | 13F | Glenmede Trust Co Na | 9 704 | 442 | ||||||
| 2026-02-03 | 13F | Crossmark Global Holdings, Inc. | 27 520 | −17,99 | 1 254 | 3,38 | ||||
| 2026-03-12 | 13F/A | Peak6 Llc | Call | 208 500 | −38,31 | 9 501 | −22,24 | |||
| 2026-02-13 | 13F | Arrowstreet Capital, Limited Partnership | 5 300 | −85,58 | 242 | −81,85 | ||||
| 2026-02-17 | 13F | Advisor Group Holdings, Inc. | 18 027 | 2,75 | 822 | 37,29 | ||||
| 2025-11-07 | 13F | Sierra Ocean, Llc | 0 | −100,00 | 0 | −100,00 | ||||
| 2026-02-10 | 13F | Hallstatt Advisors L.p. | 187 455 | 8 542 | ||||||
| 2026-02-06 | 13F | Pinnbrook Capital Management Lp | 0 | −100,00 | 0 | |||||
| 2026-01-29 | 13F | IMC-Chicago, LLC | 10 509 | −24,42 | 479 | −4,78 | ||||
| 2026-01-29 | 13F | IMC-Chicago, LLC | Put | 28 600 | −24,74 | 1 303 | −5,10 | |||
| 2025-11-10 | 13F | Optiver Holding B.V. | 0 | −100,00 | 0 | −100,00 | ||||
| 2026-02-17 | 13F | Optiver Holding B.V. | Put | 637 400 | −27,25 | 29 046 | −8,29 | |||
| 2026-02-17 | 13F | Optiver Holding B.V. | Call | 875 500 | 26,57 | 39 897 | 59,56 | |||
| 2026-04-07 | 13F | GK Wealth Management LLC | 0 | −100,00 | 0 | |||||
| 2026-02-13 | 13F | Ubs Asset Management Americas Inc | 973 | 44 | ||||||
| 2025-11-13 | 13F | Total Investment Management Inc | 0 | −100,00 | 0 | |||||
| 2026-04-22 | 13F | Spire Wealth Management | 150 | 16,28 | 8 | 40,00 | ||||
| 2026-01-30 | 13F | Carrera Capital Advisors | 102 544 | 4 673 | ||||||
| 2026-02-13 | 13F | Charles Schwab Investment Management Inc | 113 687 | 6,68 | 5 181 | 34,48 | ||||
| 2026-02-12 | 13F | Callan Family Office, LLC | 14 946 | 63,27 | 681 | 106,36 | ||||
| 2026-02-13 | 13F | Mml Investors Services, Llc | 21 093 | 51,75 | 961 | 91,43 | ||||
| 2026-02-12 | 13F | Commonwealth Equity Services, Llc | 4 711 | 215 | ||||||
| 2026-02-13 | 13F | Jb Capital Partners Lp | 205 000 | 0,00 | 9 342 | 26,06 | ||||
| 2026-02-13 | 13F | Neuberger Berman Group LLC | 253 848 | −8,95 | 11 562 | 14,37 |